关于ANR异常捕获与分析,你所需要知道的一切

背景

最近项目组需要实现捕获ANR并上传到公司服务器相关的功能,因此花了点时间来整理相关的知识,并从AMS源码与腾讯Bugly-SDK中逆向找到相关思路,在此分享给大家。

ANR是什么?

Application Not Responding的缩写,即应用程序无响应。简单来说,就是应用跑着跑着,突然duang~,界面卡住了,无法响应用户的操作如触摸事件等。

触发ANR的原因

  • 应用进程自身引起
    例如:
    1.主线程阻塞、挂起、死循环
    2.应用进程的其他线程的CPU占用率高,使得主线程无法抢占到CPU时间片

  • 其他进程间接引起(误伤)
    例如:
    1.当前应用进程进行进程间通信请求其他进程,其他进程的操作长时间没有反馈
    2.其他进程的CPU占用率极高,使得当前应用进程无法抢占到CPU时间片

ANR的分类:

  1. 应用在5秒内未响应用户的输入事件,如按键或触摸事件
  2. BroadcastReceiver未在10秒内完成相关的处理
  3. Service的各个生命周期函数时20秒内没有执行完毕

主要还是以上3种情况,其根本原因都是主线程被阻塞导致的。

Tips:
其中2,3属于Background ANR,实际上已经发生了ANR,但不会进行对话框弹出。可以在Android开发者选项—>高级—>显示所有”应用程序无响应“,勾选后即可对后台ANR也进行弹框显示。

问题分解

要实现捕获ANR功能,简单来说,需要解决以下问题:

  1. 获取什么信息?
  2. 去哪里获取?
  3. 什么时候去获取?

对于上述问题,我们一步一步来,逐个解决。

一、获取什么信息?

1. Cause reason:
当ANR产生的时候,logcat会打印出一段log,会输出类似下面的信息。

1) 首先可以得到ANR所在进程的进程名、进程号、及出错的组件;
2) 其中Reason主要描述了ANR产生的具体原因/分类;
3) CPU usage...ago则主要记录了ANR发生前CPU的使用状况;
4) CPU usage...later则记录了ANR发生之后CPU的使用状况。

1
2
3
4
5
6
7
8
9
10
11
12
13
14
15
16
17
18
E/ActivityManager: ANR in com.example.testapp (com.example.testapp/.CrashTestActivity)
PID: 2480
Reason: Input dispatching timed out (Waiting because the touched window has not finished processing the input events that were previously delivered to it.)
Load: 0.06 / 0.08 / 0.05
CPU usage from 9865ms to 0ms ago:
0.7% 1558/system_server: 0% user + 0.7% kernel / faults: 39 minor
0.4% 1143/adbd: 0% user + 0.4% kernel / faults: 117 minor
0.4% 1796/com.estrongs.android.pop: 0.2% user + 0.2% kernel / faults: 95 minor
0.2% 1132/surfaceflinger: 0% user + 0.2% kernel
0.1% 1114/kworker/0:1H: 0% user + 0.1% kernel
0.1% 1131/rild: 0% user + 0.1% kernel
0.1% 1682/com.android.phone: 0% user + 0.1% kernel
+0% 2510/logcat: 0% user + 0% kernel
0.8% TOTAL: 0.1% user + 0.7% kernel + 0% iowait
CPU usage from 1098ms to 1603ms later:
2% 1558/system_server: 2% user + 0% kernel
2% 1573/ActivityManager: 2% user + 0% kernel
0% TOTAL: 0% user + 0% kernel

结合此部分信息进行分析可以初步得出产生ANR的基本原因,以及排除是否属于误伤。什么意思呢?也就是说如果发现ANR前后有某个进程在占用大量CPU,那么ANR的产生很可能是误伤-_-|||,具体可以回看上面关于ANR触发原因一节。

2. ANR traces
在知道了Cause reason之后,需要进一步的信息来确定ANR在代码中的位置,这个时候就要去查看traces文件了。每次产生ANR之后,系统都会向/data/anr/traces.txt中写入新的数据。内容大概如下:
1)介于----- pid 0000 xxx ---------- end 0000 -----之间的为进程0000的所有线程堆栈信息。一般来说,发生ANR的进程信息会在文件头部,下面AMS源码分析的时候会说明为什么。
2) "main" prio=5 tid=1 TIMED_WAIT分为为线程名、线程优先级(默认值5)、线程ID、线程状态;主线程之后会接着打印进程中其他线程的信息,此处不再贴出。

1
2
3
4
5
6
7
8
9
10
11
12
13
14
15
16
17
18
19
20
21
22
23
24
25
26
27
28
29
30
31
32
33
34
35
36
37
38
39
40
41
42
43
44
45
46
47
48
49
50
----- pid 2480 at 2017-04-06 08:48:58 -----
Cmd line: com.example.testapp

JNI: CheckJNI is on; workarounds are off; pins=0; globals=263

DALVIK THREADS:
(mutexes: tll=0 tsl=0 tscl=0 ghl=0)

"main" prio=5 tid=1 TIMED_WAIT
| group="main" sCount=1 dsCount=0 obj=0xaccdcbd8 self=0xb80204a0
| sysTid=2480 nice=0 sched=0/0 cgrp=[fopen-error:2] handle=-1217093536
| state=S schedstat=( 0 0 0 ) utm=2 stm=1 core=1
at java.lang.VMThread.sleep(Native Method)
at java.lang.Thread.sleep(Thread.java:1013)
at java.lang.Thread.sleep(Thread.java:995)
at com.tencent.bugly.proguard.ag.a(BUGLY:897)
at com.tencent.bugly.crashreport.crash.anr.BuglyTestANR_Reciver.onReceive(BUGLY:30)
at android.app.LoadedApk$ReceiverDispatcher$Args.run(LoadedApk.java:768)
at android.os.Handler.handleCallback(Handler.java:733)
at android.os.Handler.dispatchMessage(Handler.java:95)
at android.os.Looper.loop(Looper.java:136)
at android.app.ActivityThread.main(ActivityThread.java:5017)
at java.lang.reflect.Method.invokeNative(Native Method)
at java.lang.reflect.Method.invoke(Method.java:515)
at com.android.internal.os.ZygoteInit$MethodAndArgsCaller.run(ZygoteInit.java:779)
at com.android.internal.os.ZygoteInit.main(ZygoteInit.java:595)
at dalvik.system.NativeStart.main(Native Method)

"AnotherThread1" xxx
xxx
xxx
xxx

"AnotherThread2" xxx
xxx
xxx
xxx

----- end 2480 -----

----- pid 1558 at 2017-04-06 08:48:58 -----
Cmd line: another_process_name
...
...
...
----- end 2480 -----

...
...
...

Tips:
关于ANR traces的保存时长:
traces.txt:只保留最近一次发生ANR时的信息,位置:/data/anr/traces.txt
DropBox: Android 2.2 开始增加, 会保留历史上发生的所有ANR的logs,位置:/data/system/dropbox,保存时长3天。详见:ActivityManagerService.addErrorToDropBox()

相关源码:
ActivityManagerService.java
DropBoxManagerService.java
SystemServer.java

3. 关于线程状态
了解线程的状态对分析traces文件至关重要,下表列出了各线程的状态及含义:
ThreadState

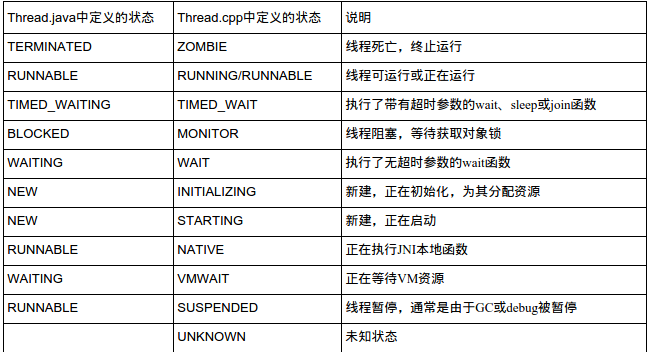
Read The Fucking Source Code

在解释后面的两个问题:2.去哪里获取?3.什么时候去获取?之前,我们需要简单的阅读下ActivityManagerService的源码了。

1) 在产生ANR的时候,会回调到AMS的appNotResponding()方法,以下为关键代码,中文注释为相关代码的解读:

1
2
3
4
5
6
7
8
9
10
11
12
13
14
15
16
17
18
19
20
21
22
23
24
25
26
27
28
29
30
31
32
33
34
35
36
37
38
39
40
41
42
43
44
45
46
47
48
49
50
51
52
53
54
55
56
57
58
59
60
61
62
63
64
65
66
67
68
69
70
71
72
73
74
75
76
77
78
79
80
81
82
83
84
85
86
87
88
89
90
91
92
93
94
95
96
97
98
99
100
101
102
103
104
105
106
107
108
109
110
111
112
113
114
115
116
117
118
119
120
121
122
123
124
125
126
127
128
129
130
131
132
133
134
135
136
137
138
final void appNotResponding(ProcessRecord app, ActivityRecord activity,
ActivityRecord parent, boolean aboveSystem, final String annotation) {
// firstPids与lastPids将记录将要dump线程堆栈信息的进程号,其中firstPids会优先输出,详见后面的dumpStackTraces()方法
ArrayList<Integer> firstPids = new ArrayList<Integer>(5);
SparseArray<Boolean> lastPids = new SparseArray<Boolean>(20);

...

synchronized (this) {
// 判断重启、已处于ANR或Crash状态直接返回不处理
// PowerManager.reboot() can block for a long time, so ignore ANRs while shutting down.
if (mShuttingDown) {
Slog.i(TAG, "During shutdown skipping ANR: " + app + " " + annotation);
return;
} else if (app.notResponding) {
Slog.i(TAG, "Skipping duplicate ANR: " + app + " " + annotation);
return;
} else if (app.crashing) {
Slog.i(TAG, "Crashing app skipping ANR: " + app + " " + annotation);
return;
}

// 设置notResponding标志位
// In case we come through here for the same app before completing
// this one, mark as anring now so we will bail out.
app.notResponding = true;

...

// 这里将把当前进程的id最先加到列表中,因此能保证产生ANR的进程能在traces.txt的头部。
// Dump thread traces as quickly as we can, starting with "interesting" processes.
firstPids.add(app.pid);

int parentPid = app.pid;
if (parent != null && parent.app != null && parent.app.pid > 0) parentPid = parent.app.pid;
if (parentPid != app.pid) firstPids.add(parentPid);

if (MY_PID != app.pid && MY_PID != parentPid) firstPids.add(MY_PID);

// 将设有persistent属性的进程加入firstPids队列,其他则加入lastPids队列
// 其中mLruProcesses根据LRU算法存储了最近使用的进程信息
for (int i = mLruProcesses.size() - 1; i >= 0; i--) {
ProcessRecord r = mLruProcesses.get(i);
if (r != null && r.thread != null) {
int pid = r.pid;
if (pid > 0 && pid != app.pid && pid != parentPid && pid != MY_PID) {
if (r.persistent) {
firstPids.add(pid);
} else {
lastPids.put(pid, Boolean.TRUE);
}
}
}
}
}

// 准备在logcat中打印出Cause Reason信息
// Log the ANR to the main log.
StringBuilder info = new StringBuilder();
info.setLength(0);
info.append("ANR in ").append(app.processName);
if (activity != null && activity.shortComponentName != null) {
info.append(" (").append(activity.shortComponentName).append(")");
}
info.append("\n");
info.append("PID: ").append(app.pid).append("\n");
if (annotation != null) {
info.append("Reason: ").append(annotation).append("\n");
}
if (parent != null && parent != activity) {
info.append("Parent: ").append(parent.shortComponentName).append("\n");
}

final ProcessCpuTracker processCpuTracker = new ProcessCpuTracker(true);

// 执行此函数将dump相关进程中的线程堆栈信息到traces.txt文件中
File tracesFile = dumpStackTraces(true, firstPids, processCpuTracker, lastPids,
NATIVE_STACKS_OF_INTEREST);

String cpuInfo = null;
// 打印CPU usage相关信息
if (MONITOR_CPU_USAGE) {
updateCpuStatsNow();
synchronized (mProcessCpuTracker) {
cpuInfo = mProcessCpuTracker.printCurrentState(anrTime);
}
info.append(processCpuTracker.printCurrentLoad());
info.append(cpuInfo);
}

info.append(processCpuTracker.printCurrentState(anrTime));

Slog.e(TAG, info.toString());
if (tracesFile == null) {
// There is no trace file, so dump (only) the alleged culprit's threads to the log
Process.sendSignal(app.pid, Process.SIGNAL_QUIT);
}

// 添加ANR信息至DropBox,默认有效期为3天
addErrorToDropBox("anr", app, app.processName, activity, parent, annotation,
cpuInfo, tracesFile, null);

...

// 此处获取开发者选项—>高级—>显示所有"应用程序无响应"中的值,若勾选了显示Background ANR,则会显示Broadcast等后台组件所产生的ANR Dialog
// Unless configured otherwise, swallow ANRs in background processes & kill the process.
boolean showBackground = Settings.Secure.getInt(mContext.getContentResolver(),
Settings.Secure.ANR_SHOW_BACKGROUND, 0) != 0;

synchronized (this) {
mBatteryStatsService.noteProcessAnr(app.processName, app.uid);

if (!showBackground && !app.isInterestingToUserLocked() && app.pid != MY_PID) {
app.kill("bg anr", true);
return;
}

// Set the app's notResponding state, and look up the errorReportReceiver
makeAppNotRespondingLocked(app,
activity != null ? activity.shortComponentName : null,
annotation != null ? "ANR " + annotation : "ANR",
info.toString());

// 通过hander发送消息,通知显示ANR Dialog
// Bring up the infamous App Not Responding dialog
Message msg = Message.obtain();
HashMap<String, Object> map = new HashMap<String, Object>();
msg.what = SHOW_NOT_RESPONDING_MSG;
msg.obj = map;
msg.arg1 = aboveSystem ? 1 : 0;
map.put("app", app);
if (activity != null) {
map.put("activity", activity);
}

mHandler.sendMessage(msg);
}
}

2) 我们来详细看下dumpStackTraces()这个方法,此处将dump出firstPidslastPids进程的相关线程堆栈信息至traces.txt,中文注释为相关代码的解读。

1
2
3
4
5
6
7
8
9
10
11
12
13
14
15
16
17
18
19
20
21
22
23
24
25
26
27
28
29
30
31
32
33
34
35
36
37
38
39
40
41
42
43
44
45
46
47
48
49
50
51
52
53
54
55
56
57
58
59
60
61
62
63
64
65
66
67
68
69
70
71
72
73
74
75
76
77
78
79
80
81
82
83
84
85
86
87
88
89
90
91
92
93
94
95
96
97
98
99
100
101
102
103
104
105
106
107
108
109
110
111
public static File dumpStackTraces(boolean clearTraces, ArrayList<Integer> firstPids,
ProcessCpuTracker processCpuTracker, SparseArray<Boolean> lastPids, String[] nativeProcs) {
// 根据此环境变量获取traces.txt生成路径,默认值为/data/anr/traces.txt
String tracesPath = SystemProperties.get("dalvik.vm.stack-trace-file", null);
if (tracesPath == null || tracesPath.length() == 0) {
return null;
}

File tracesFile = new File(tracesPath);
try {
File tracesDir = tracesFile.getParentFile();
if (!tracesDir.exists()) {
tracesDir.mkdirs();
if (!SELinux.restorecon(tracesDir)) {
return null;
}
}
// 删除旧的traces.txt文件,并创建新文件
FileUtils.setPermissions(tracesDir.getPath(), 0775, -1, -1); // drwxrwxr-x

if (clearTraces && tracesFile.exists()) tracesFile.delete();
tracesFile.createNewFile();
FileUtils.setPermissions(tracesFile.getPath(), 0666, -1, -1); // -rw-rw-rw-
} catch (IOException e) {
Slog.w(TAG, "Unable to prepare ANR traces file: " + tracesPath, e);
return null;
}

dumpStackTraces(tracesPath, firstPids, processCpuTracker, lastPids, nativeProcs);
return tracesFile;
}

private static void dumpStackTraces(String tracesPath, ArrayList<Integer> firstPids,
ProcessCpuTracker processCpuTracker, SparseArray<Boolean> lastPids, String[] nativeProcs) {
// Use a FileObserver to detect when traces finish writing.
// The order of traces is considered important to maintain for legibility.
// 每个进程是按照先后顺序dump信息至traces.txt文件中的
// 通过FileObserver监听完成写入的操作,并通过wait()/notify()机制等待/唤醒,并继续发送Signal给下一个进程,见下面的for循环
FileObserver observer = new FileObserver(tracesPath, FileObserver.CLOSE_WRITE) {
@Override
public synchronized void onEvent(int event, String path) { notify(); }
};

try {
observer.startWatching();

// First collect all of the stacks of the most important pids.
if (firstPids != null) {
try {
int num = firstPids.size();
for (int i = 0; i < num; i++) {
synchronized (observer) {
// 目标进程的虚拟机实例接收到SIGNAL_QUIT信号后会由"Signal Catcher"线程将进程中各个线程的函数堆栈信息输出到traces.txt文件中.
// 优先输出firstPids中的进程堆栈信息
Process.sendSignal(firstPids.get(i), Process.SIGNAL_QUIT);
observer.wait(200); // Wait for write-close, give up after 200msec
}
}
} catch (InterruptedException e) {
Slog.wtf(TAG, e);
}
}

// Next collect the stacks of the native pids
if (nativeProcs != null) {
int[] pids = Process.getPidsForCommands(nativeProcs);
if (pids != null) {
for (int pid : pids) {
Debug.dumpNativeBacktraceToFile(pid, tracesPath);
}
}
}

// Lastly, measure CPU usage.
if (processCpuTracker != null) {
processCpuTracker.init();
System.gc();
processCpuTracker.update();
try {
synchronized (processCpuTracker) {
processCpuTracker.wait(500); // measure over 1/2 second.
}
} catch (InterruptedException e) {
}
processCpuTracker.update();

// 获取最近频繁使用CPU的进程
// We'll take the stack crawls of just the top apps using CPU.
final int N = processCpuTracker.countWorkingStats();
int numProcs = 0;
for (int i=0; i<N && numProcs<5; i++) {
ProcessCpuTracker.Stats stats = processCpuTracker.getWorkingStats(i);
// 根据频繁使用CPU的进程与lastPids输出相关进程堆栈信息
if (lastPids.indexOfKey(stats.pid) >= 0) {
numProcs++;
try {
synchronized (observer) {
Process.sendSignal(stats.pid, Process.SIGNAL_QUIT);
observer.wait(200); // Wait for write-close, give up after 200msec
}
} catch (InterruptedException e) {
Slog.wtf(TAG, e);
}

}
}
}
} finally {
observer.stopWatching();
}
}

二、去哪里获取?

1. Cause reason:

  • 关于reason信息的获取,到目前为止,我们只知道能在logcat中能检索到相关信息,难道要开个线程不断循环去检测logs?这想法看来还是Too Young Too Simple。
  • 这里先说下结论,可通过ActivityManagerService.getProcessesInErrorState()方法获取进程的ANR信息,此方法是通过逆向Bugly时发现的,后面会讲到。
  • 此方法会遍历mLruProcesses,并根据进程目前的异常状态如crash或者anr类型,返回具体的ProcessErrorStateInfo,具体看代码,比较简单:
    1
    2
    3
    4
    5
    6
    7
    8
    9
    10
    11
    12
    13
    14
    15
    16
    17
    18
    19
    20
    21
    22
    23
    24
    25
    26
    27
    28
    29
    30
    31
    32
    33
    34
    35
    36
    37
    public List<ActivityManager.ProcessErrorStateInfo> getProcessesInErrorState() {
    ...

    synchronized (this) {

    // iterate across all processes
    for (int i=mLruProcesses.size()-1; i>=0; i--) {
    ProcessRecord app = mLruProcesses.get(i);
    if (!allUsers && app.userId != userId) {
    continue;
    }
    if ((app.thread != null) && (app.crashing || app.notResponding)) {
    // This one's in trouble, so we'll generate a report for it
    // crashes are higher priority (in case there's a crash *and* an anr)
    ActivityManager.ProcessErrorStateInfo report = null;
    if (app.crashing) {
    report = app.crashingReport;
    } else if (app.notResponding) {
    report = app.notRespondingReport;
    }

    if (report != null) {
    if (errList == null) {
    errList = new ArrayList<ActivityManager.ProcessErrorStateInfo>(1);
    }
    errList.add(report);
    } else {
    Slog.w(TAG, "Missing app error report, app = " + app.processName +
    " crashing = " + app.crashing +
    " notResponding = " + app.notResponding);
    }
    }
    }
    }

    return errList;
    }

注意app.notRespondingReport非空的时候才会返回,那它是什么时候初始化的呢?是在makeAppNotRespondingLocked()方法中。其中此方法又是在appNotResponding()中被调用的(在所有进程写完traces.txt之后,可回看上面AMS相关代码)

1
2
3
4
5
6
7
8
9
private void makeAppNotRespondingLocked(ProcessRecord app,
String activity, String shortMsg, String longMsg) {
app.notResponding = true;
app.notRespondingReport = generateProcessError(app,
ActivityManager.ProcessErrorStateInfo.NOT_RESPONDING,
activity, shortMsg, longMsg, null);
startAppProblemLocked(app);
app.stopFreezingAllLocked();
}

2. ANR traces
这部分内容获取比较简单,直接读取/data/anr/traces.txt里面第一个进程的信息即可,能保证首个进程即是当前ANR的进程,至于为什么上面分析AMS源码中已经说明了,当前进的pid会首先被add进firstPids中被优先输出。此处的难点是如何从traces中过滤出相关的信息,如进程名,进程pid,生成时间,各线程名、tid、优先级、状态、堆栈信息等。这里就要用到强大的正则表达式来进行过滤了,此处忽略一万字…(大家可以反编译Bugly的SDK,参考里面的正则表达式)

三、什么时候去获取?

在上面AMS的源码分析中,我们可以关注到dumpStackTraces()方法中的FileObserver,系统通过该类监听文件/data/anr/traces.txt来达到顺序依次写入各个进程的traces信息。按照这个思路,当ANR发生的时候,我们也可以通过监听该文件的写入情况来判断是否发生了ANR,看起来这是一个不错的时机。需要注意的一点是,所有应用发生ANR的时候都会进行回调,因此需要做一些过滤与判断,如包名、进程号等。

在实现前,我们先来看看Bugly中是如何实现的。这里笔者反编译的是Bugly-v1.2.8版本,搜索关键字FileObserver,果不其然很快发现了一些相关代码,位于com.tencent.bugly.crashreport.crash.anr包下的b.class

1
2
3
4
5
6
7
8
9
10
11
12
13
14
15
16
17
18
19
20
21
22
23
24
25
26
27
protected synchronized void b() {
if(this.d()) {
z.d("start when started!", new Object[0]);
} else {
this.o = new FileObserver("/data/anr/", 8) {
public void onEvent(int event, String path) {
if(path != null) {
String var3 = "/data/anr/" + path;
if(!var3.contains("trace")) {
z.d("not anr file %s", new Object[]{var3});
} else {
b.this.a(var3);
}
}
}
};
try {
this.o.startWatching();
z.a("start anr monitor!", new Object[0]);
...
} catch (Throwable var2) {
this.o = null;
z.d("start anr monitor failed!", new Object[0]);
...
}
}
}

上面这段代码比较简单,就是一个启动monitor的方法,监听/data/anr/这个目录,并过滤包含trace的文件名。在FileObserver创建的时候可以传入一个mask参数,8正是代表着CLOSE_WRITE这个常量,当有写入并且close的时候将会回调,跟AMS中的使用基本吻合。

继续翻看b.class的代码,当过滤出trace文件的时候,会执行b.this.a(var3)这个方法。从代码逻辑上可以看出,这是一个对trace文件有效性判断的方法,精简过后的代码如下:

1
2
3
4
5
6
7
8
9
10
11
12
13
14
15
16
17
18
19
20
21
22
23
24
25
26
27
28
29
30
31
32
33
34
35
36
37
public final void a(String var1) {
....
try {
z.c("read trace first dump for create time!", new Object[0]);
long var2 = -1L;
com.tencent.bugly.crashreport.crash.anr.c.a var4 = com.tencent.bugly.crashreport.crash.anr.c.a(var1, false);
if(var4 != null) {
var2 = var4.c;
}
if(var2 == -1L) {
z.d("trace dump fail could not get time!", new Object[0]);
var2 = (new Date()).getTime();
}
if(Math.abs(var2 - this.f) < 10000L) {
z.d("should not process ANR too Fre in %d", new Object[]{Integer.valueOf(10000)});
} else {
...
if(var5 != null && var5.size() > 0) {
ProcessErrorStateInfo var6 = this.a(this.g, 10000L);
if(var6 == null) {
z.c("proc state is unvisiable!", new Object[0]);
} else if(var6.pid != Process.myPid()) {
z.c("not mind proc!", new Object[]{var6.processName});
} else {
z.a("found visiable anr , start to process!", new Object[0]);
this.a(this.g, var1, var6, var2, var5);
}
} else {
z.d("can\'t get all thread skip this anr", new Object[0]);
}
}
} catch (Throwable var13) {
...
z.e("handle anr error %s", new Object[]{var13.getClass().toString()});
}
...
}

上面这段代码的意思也比较好理解,先解析出时间,对一些重复的回调或太频繁的ANR进行过滤(为什么会重复回调,因为上面阅读AMS源码的时候也说明了,firstPids中各个进程的信息会依次写入trace文件中)。然后对进程异常状态和进程号进行判断,过滤掉无效或其他应用的回调,最后对有效的trace进行处理。

这个时候ProcessErrorStateInfo这个类引起了我的注意,我们继续翻代码看他到底获取的是什么信息,进入this.a(this.g, 10000L)这个方法:

1
2
3
4
5
6
7
8
9
10
11
12
13
14
15
16
17
18
19
20
21
22
23
24
25
26
protected ProcessErrorStateInfo a(Context var1, long var2) {
var2 = var2 < 0L?0L:var2;
z.c("to find!", new Object[0]);
ActivityManager var4 = (ActivityManager)var1.getSystemService("activity");
long var5 = var2 / 500L;
int var7 = 0;
do {
z.c("waiting!", new Object[0]);
List var8 = var4.getProcessesInErrorState();
if(var8 != null) {
Iterator var9 = var8.iterator();

while(var9.hasNext()) {
ProcessErrorStateInfo var10 = (ProcessErrorStateInfo)var9.next();
if(var10.condition == 2) {
z.c("found!", new Object[0]);
return var10;
}
}
}

ag.a(500L);
} while((long)(var7++) < var5);
z.c("end!", new Object[0]);
return null;
}

可以把这段代码copy到自己的项目中跑一下,首先通过ActivityManager.getProcessesInErrorState()来获取系统中有所有异常进程的信息,通过condition来过滤出目标进程,而2正是代表着NOT_RESPONDING这个常量,即ANR异常。而ProcessErrorStateInfo中的shortMsglongMsg变量正是我们之前在logcat中看到的Cause reason!

可以看到,其实Bugly对于ANR的触发时机监听也正是使用FileObserver来实现的。而且之前一直在思考logcat中的Cause reason是从哪里获取的现在也有了答案,反编译有些时候还真是个好法宝,嘿嘿嘿~

总结

至此,通过AMS源码分析和Bugly-SDK的逆向,我们终于解决了捕获ANR异常最重要的3个问题:1.获取什么信息?2.去哪里获取?3.什么时候去获取?希望这篇文章能给正在开发相关功能的同学们一些指导,顺便分享下自己的思路与经验~

参考

https://developer.android.com/training/articles/perf-anr.html#anr
http://gityuan.com/2016/07/02/android-anr/
http://blog.csdn.net/tencent_bugly/article/details/46650675